

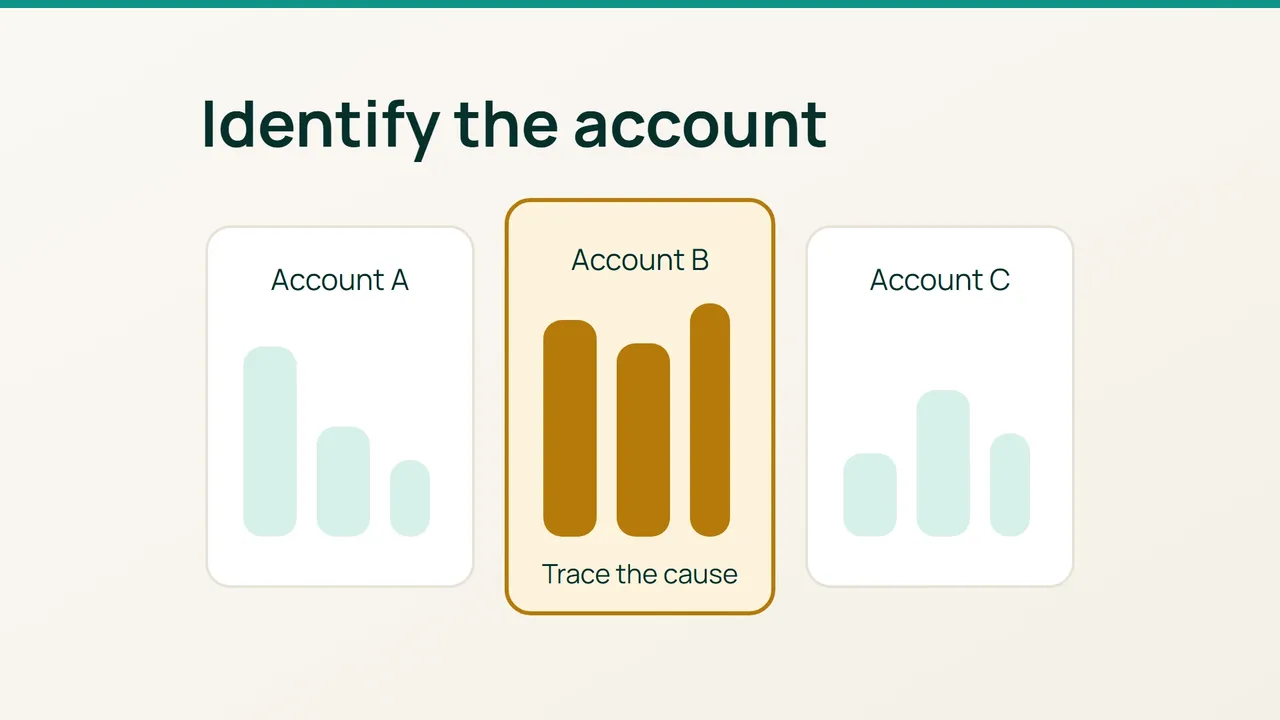
A busy MySQL daemon does not identify the customer generating its work. Likewise, a PHP process name does not necessarily reveal the script being requested. WHM’s Process Manager provides a starting point; useful attribution joins ownership, interval measurements and request evidence.
Search intent: identify the account behind a resource spike and fix its cause without disrupting other customers. The procedure requires administrative access. Keep collected commands and logs private because they may reveal application data.
1. Establish ownership and a time window
Possible explanations for high consumption
Separate a brief burst from persistent saturation or a repeating scheduled job. Legitimate traffic, overlapping cron runs, an expensive WordPress plugin, a PHP loop, bots and compromise need different responses. High usage alone is not evidence of an intrusion.
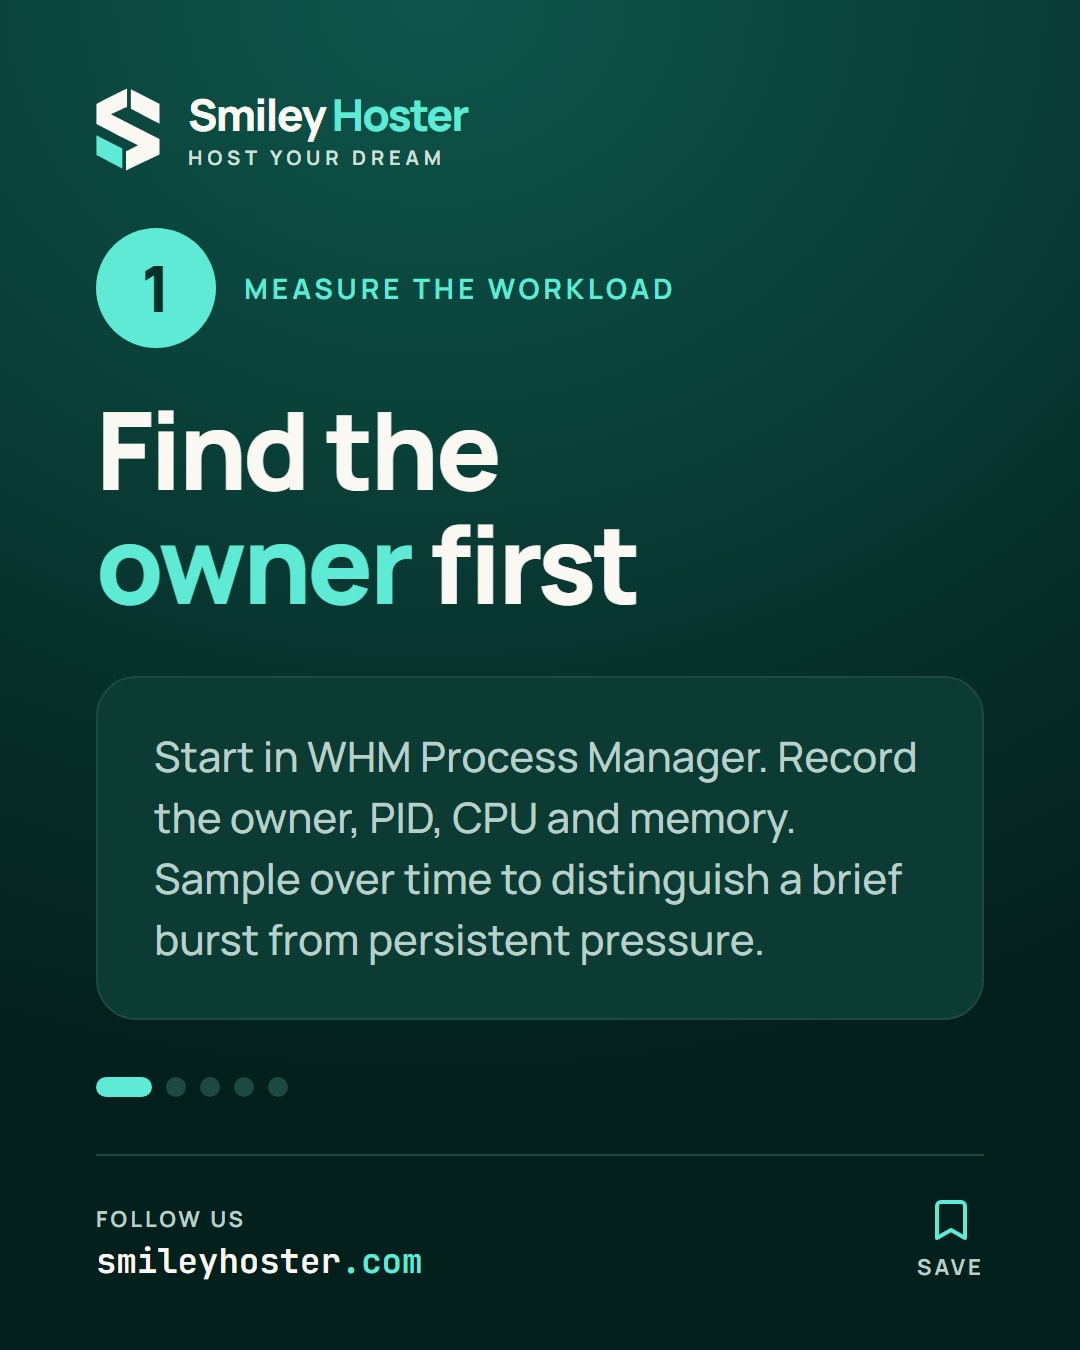
Open WHM, System Health, Process Manager and record the owner, PID, CPU and memory. Consult Daily Process Log where historical data is available. A process displaying 100% CPU may be using one core rather than the machine’s entire capacity.
ps -eo user,pid,ppid,pcpu,rss,etime,args --sort=-pcpu | head -n 25pidstat -u -r -d -U -p ALL 1 10ps -e -o user= | sort | uniq -c | sort -nrps provides a snapshot, and its CPU figure is not a precise last-second measurement. pidstat, part of sysstat, samples per-task CPU, memory and I/O over intervals. Very short jobs may vanish between samples, and I/O counters do not describe every application wait.
The final pipeline counts processes by owner. A growing count without useful throughput can indicate accumulated jobs. RSS is reported in KiB and includes shared pages; adding every RSS value is not an exact private-memory total.
Preserve evidence and a recovery point
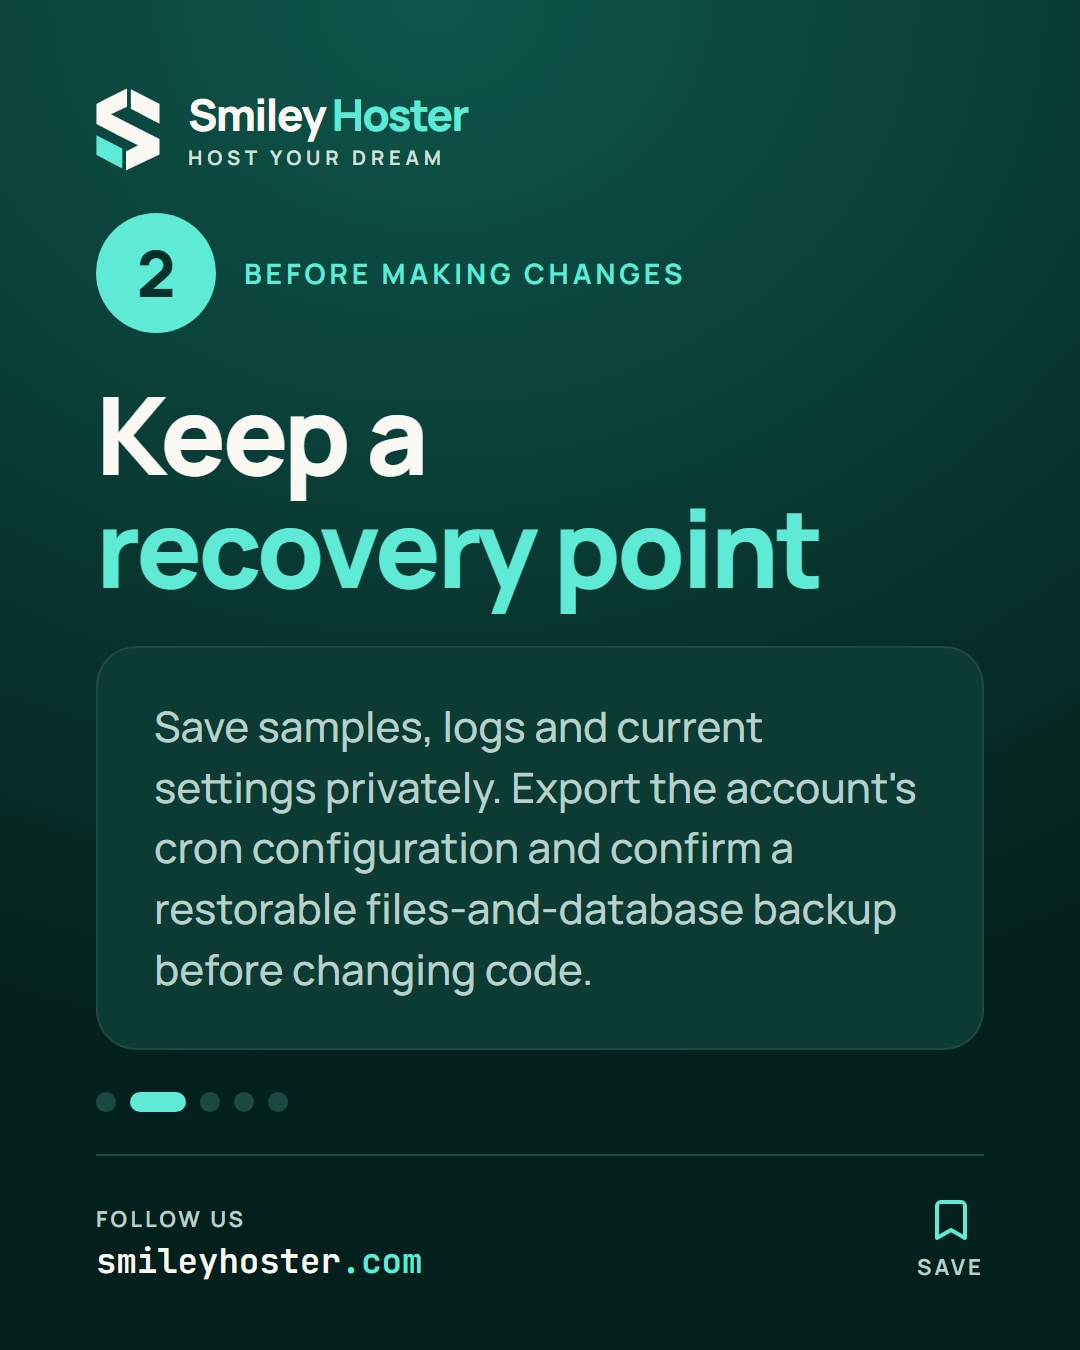
Save relevant samples, logs and account settings in a private directory before modifying the workload. Export the account’s cron configuration:
account=cpuserumask 077save=$(mktemp -d /root/account-incident.XXXXXX)crontab -u "$account" -l > "$save/crontab.txt"Replace cpuser. If no crontab exists, record that fact; do not blindly import the empty output later. Confirm a restorable files-and-database backup before changing application code. An incident-time backup is evidence, not automatically a clean recovery image.
2. Connect the account to the workload
- Confirm the process identity.
ps -u "$account" -o pid,ppid,rss,etime,argspid=12345ps -p "$pid" -o user,pid,ppid,lstart,argsreadlink "/proc/$pid/cwd"readlink "/proc/$pid/exe"Use an observed PID instead of 12345. Working directory and executable are clues, not proof of which PHP request is running. Shared workers need domain and request correlation.
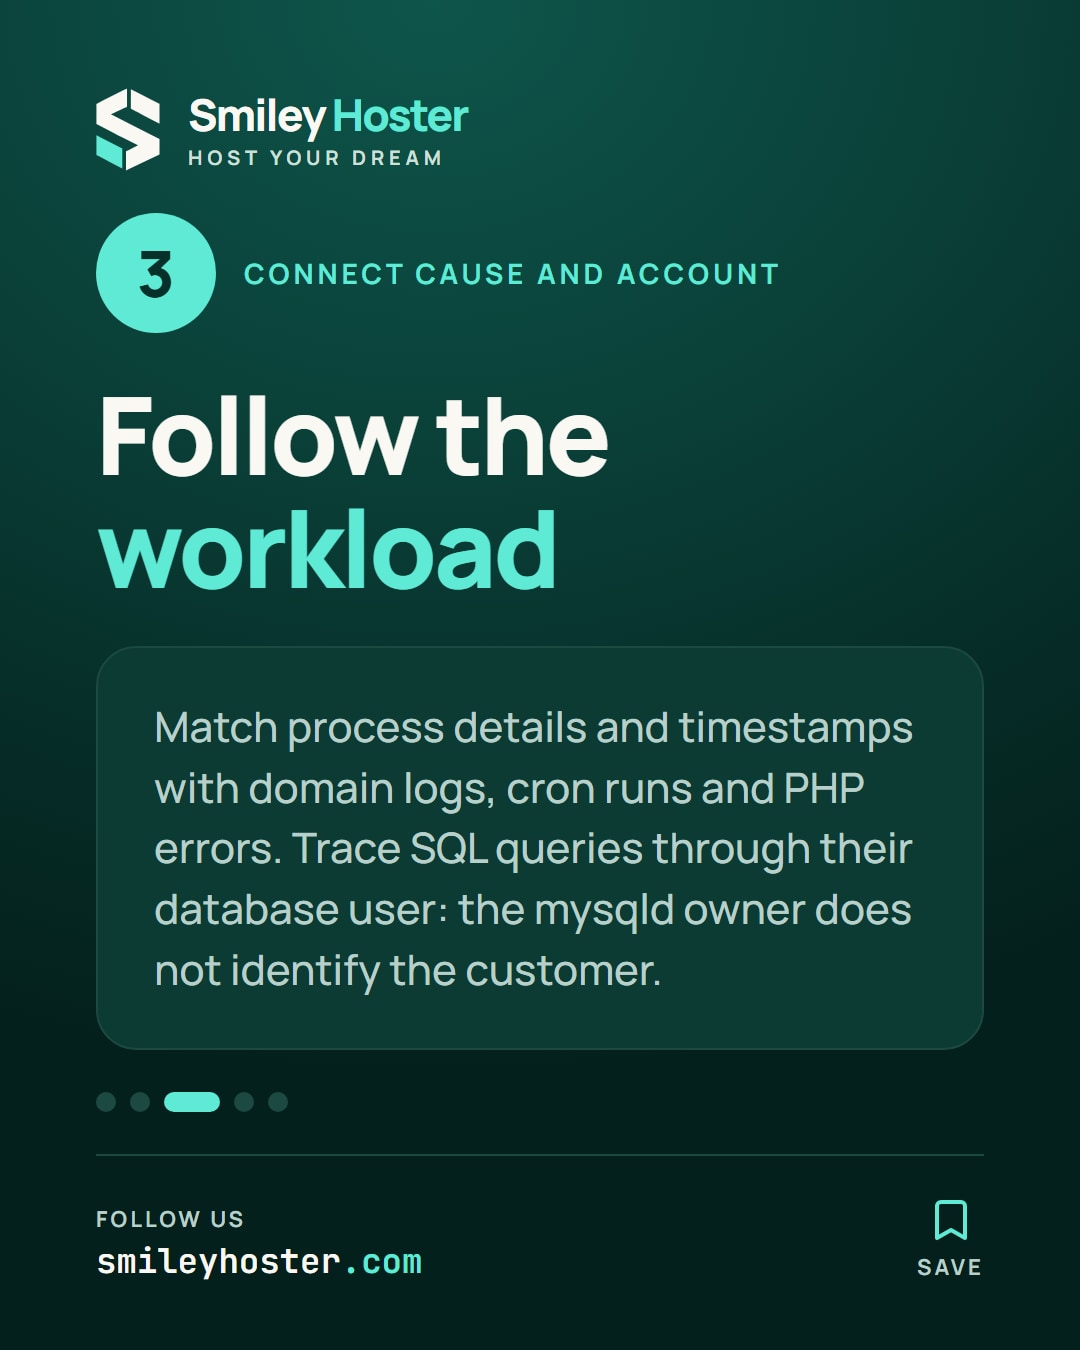
2. Match timestamps. Compare the domain’s access records under /usr/local/apache/domlogs/ with application errors, including /home/cpuser/logs/ where applicable. Check URI frequency and durations where logged. A proxy address or self-declared User-Agent alone does not establish bot identity.
3. Investigate cron and PHP. Join scheduling times with parent PIDs and elapsed runtime. Reproduce safely on a test copy. For WordPress, change the implicated plugin with a backup and an agreed maintenance approach; disabling every plugin on production creates a second incident.
4. Attribute SQL separately. Run SHOW FULL PROCESSLIST; in an authenticated administrative SQL session. Map the SQL user and database back to the account through cPanel’s database management. The operating-system owner of mysqld cannot establish which tenant issued a query.
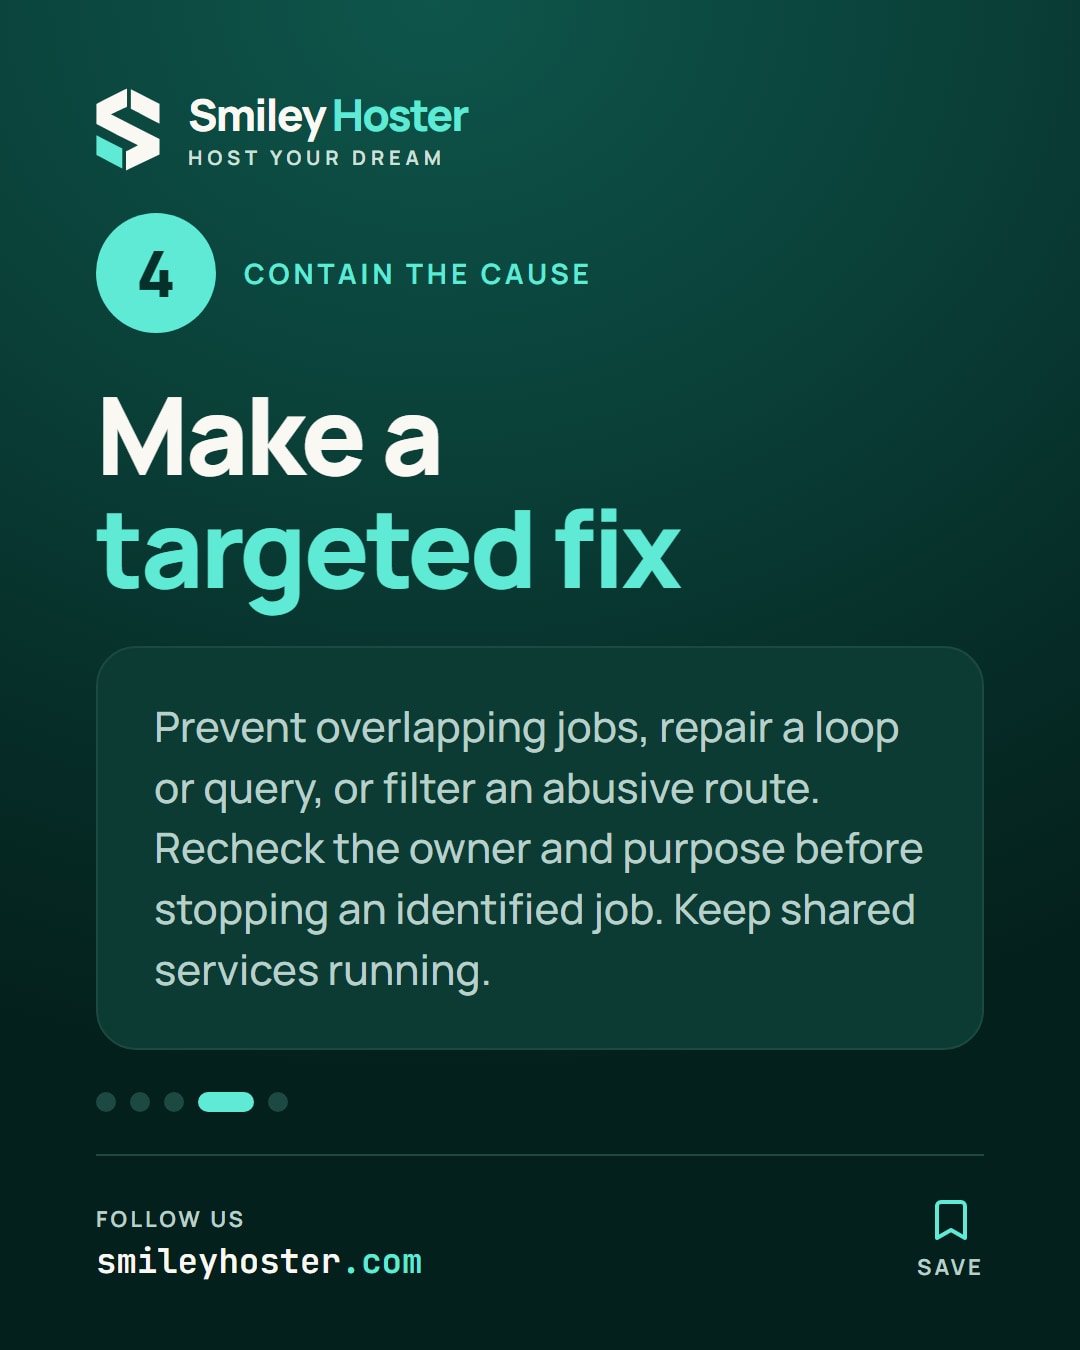
5. Choose a local correction. Prevent an overlapping job, fix a loop, repair a query or filter an abusive route. For legitimate demand, consider caching and capacity. If CloudLinux/LVE is installed, measured per-account limits can provide containment; ordinary cPanel does not automatically supply equivalent CPU, RAM and I/O isolation.
6. Stop only an identified job. Recheck its PID, owner and purpose immediately before attempting graceful termination:
kill -TERM "$pid"Do not use this on a shared service or an unknown transaction. A supervisor or cron entry that respawns the task also needs investigation.
Rollback and suspected compromise
Restore the recorded setting or known application version if the intervention causes a regression. Re-enable a scheduled job only after checking its effects. If compromise is suspected, preserve evidence, isolate the account through the incident procedure and rotate affected credentials. Restoring suspicious files just to reduce utilisation is not a safe recovery strategy.
3. Final verification
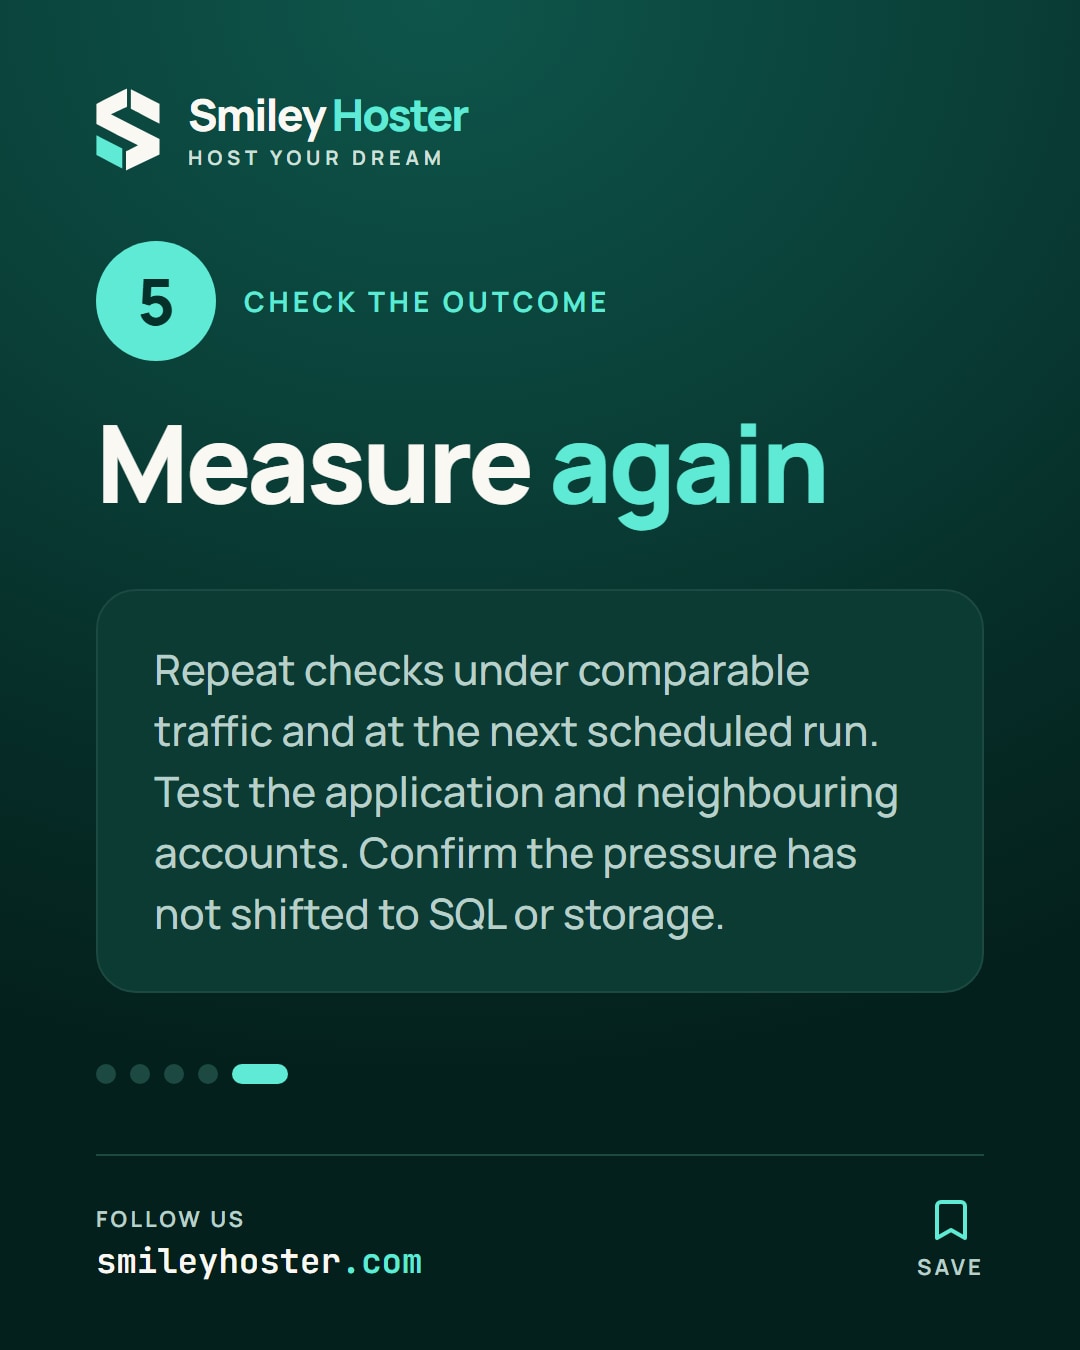
Repeat measurements under comparable traffic and during the next scheduled run. Confirm that application functions work and neighbouring accounts remain healthy. Check that the pressure has not merely moved from PHP to SQL or storage.
Common mistakes
Kill all processes by user can interrupt several applications within one account. Killing mysqld affects other customers. Aggressive limits without error monitoring can convert a performance problem into an outage.
Production recommendations
Keep a timeline linking account, domain, PID, action, previous setting and observed outcome. Establish alerts from each account’s normal workload, and review limits when traffic or application behaviour changes.
Sources: cPanel Process Manager, pidstat manual.

See it in our social posts
The key steps of this article, as a carousel. Follow us to catch the next ones.