

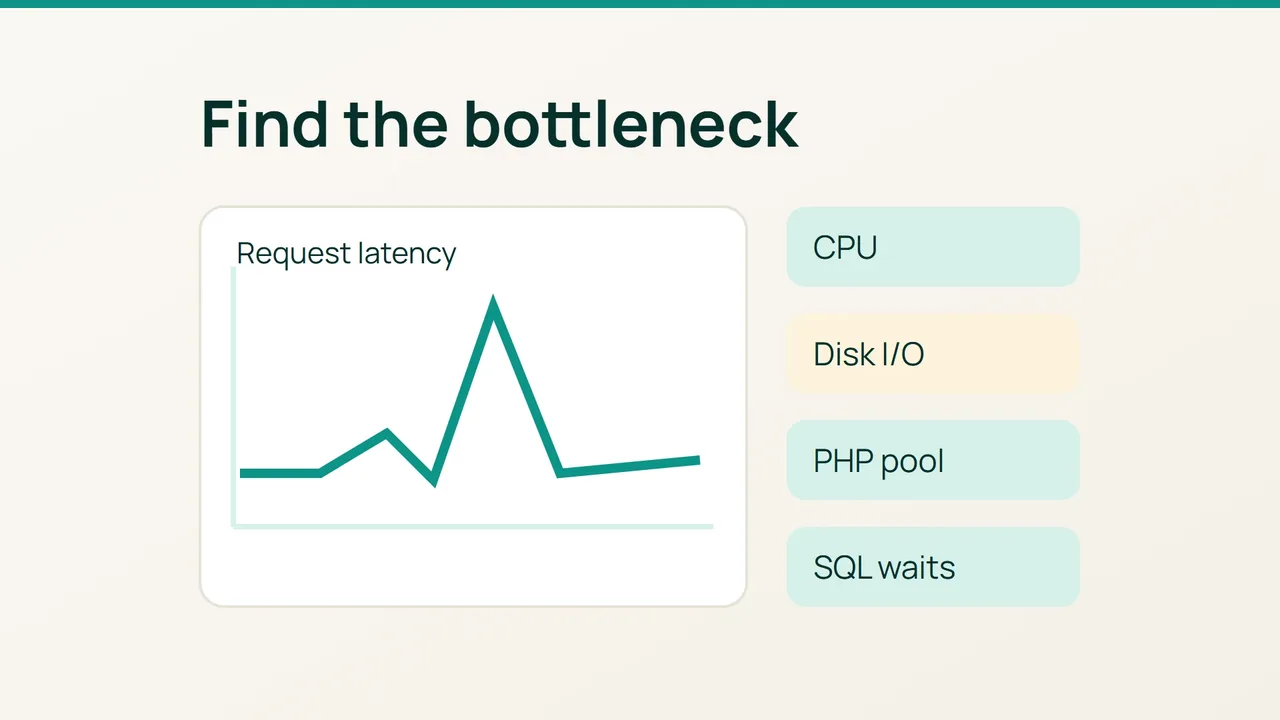
Free CPU and memory do not guarantee a responsive cPanel server. Cloudflare’s network performance update is a useful reminder to measure the request path; at the origin, the practical question is which resource or dependency makes a request wait.
Search intent: identify the cause of slow cPanel/WHM responses before changing service limits. These checks are intended for an administrator with root access.
1. Record the incident while it is happening
Symptoms and likely causes
Start with a timestamp, affected domain, URL, HTTP status and response time. Test static content and a dynamic page from the same location. An idle-looking machine may have one busy core, storage latency, a database lock or an exhausted PHP pool. Linux memory used for cache is not automatically a shortage.
Capture a short sample:
date -Isuptimenproctop -chtopfree -mvmstat 1 10sar -u 1 10iostat -xz 1 10df -hdf -iExit interactive tools with q. htop is optional, while sar and iostat belong to sysstat. Arrange installation through your OS package manager if necessary; avoid a broad system update in the middle of an outage. The initial vmstat/iostat report can cover time since boot, so use subsequent samples for the current incident.
Inspect individual cores in top. A sustained runnable queue in vmstat’s r column suggests CPU contention. Blocked tasks, I/O wait and elevated disk await belong in a storage investigation. Repeated swap-in/swap-out with little available memory suggests memory pressure. Interpret these signals together instead of treating one threshold as a diagnosis.
Preserve evidence and a recovery point
Keep outputs private, record current WHM settings and confirm that affected accounts have a restorable backup before changing anything. Before a MySQL configuration change, for example:
umask 077diag=$(mktemp -d /root/cpanel-diag.XXXXXX)cp -a /etc/my.cnf "$diag/"Also preserve files referenced by include directives. A configuration copy does not back up database contents.
2. Follow the evidence to the responsible layer
- Storage: line up the incident with backups, imports and scheduled jobs. Check both free space and inodes. Compare latency across samples; disk utilisation alone can mislead on parallel storage devices. Do not add concurrency to an already delayed storage path.
- Database: connect using your existing administrative authentication with
mysql, then inspect:
SHOW FULL PROCESSLIST;SHOW ENGINE INNODB STATUSGLook for repeated work and lock waits. Match the database and SQL user to the cPanel account before acting. Idle connections are not proof of overload. Treat captured queries as sensitive operational data.
3. Web server: use WHM’s Server Status, Apache Status for an Apache installation. Compare the affected domain’s records under /usr/local/apache/domlogs/ with /usr/local/apache/logs/error_log. On LiteSpeed, inspect its live status and configured logs instead of assuming Apache worker settings apply.
4. PHP and account processes: WHM’s System Health, Process Manager helps identify owners and PIDs. With Apache PHP-FPM, inspect the appropriate version’s log, such as /opt/cpanel/ea-php83/root/usr/var/log/php-fpm/error.log; substitute the installed version. Busy workers may be waiting on SQL or a remote API. LiteSpeed’s lsphp requires its own investigation.
For a PHP queue, ask whether useful work increases when concurrency increases. If latency grows while the database waits lengthen, more workers are not the answer.
Apply one correction and define rollback
Move a competing backup, repair an expensive query or adjust the affected domain’s pool only when measurements support it. Record the previous value and use WHM’s relevant interface. If errors or latency worsen, restore that value, validate the configuration and reload only the affected service using its supported procedure.
3. Final verification
Repeat the original requests and observation window under comparable traffic. Confirm response times, HTTP failures, available memory, swap activity and storage latency. Check neighbouring accounts too, and include the next scheduled job in follow-up monitoring.
Common mistakes
Restarting everything destroys useful evidence. Increasing PHP workers and SQL connections together can turn a queue into a memory shortage. Killing an account’s entire process tree is not a diagnostic test.
Production recommendations
Keep an incident record with a hypothesis and before/after measurements for each change. Escalate a storage problem with interval data, not a screenshot of load average. When internal responses are healthy but external tests remain slow, investigate DNS, networking and proxies before tuning the origin again.
Sources: Cloudflare’s network performance update, cPanel on troubleshooting high server loads.