

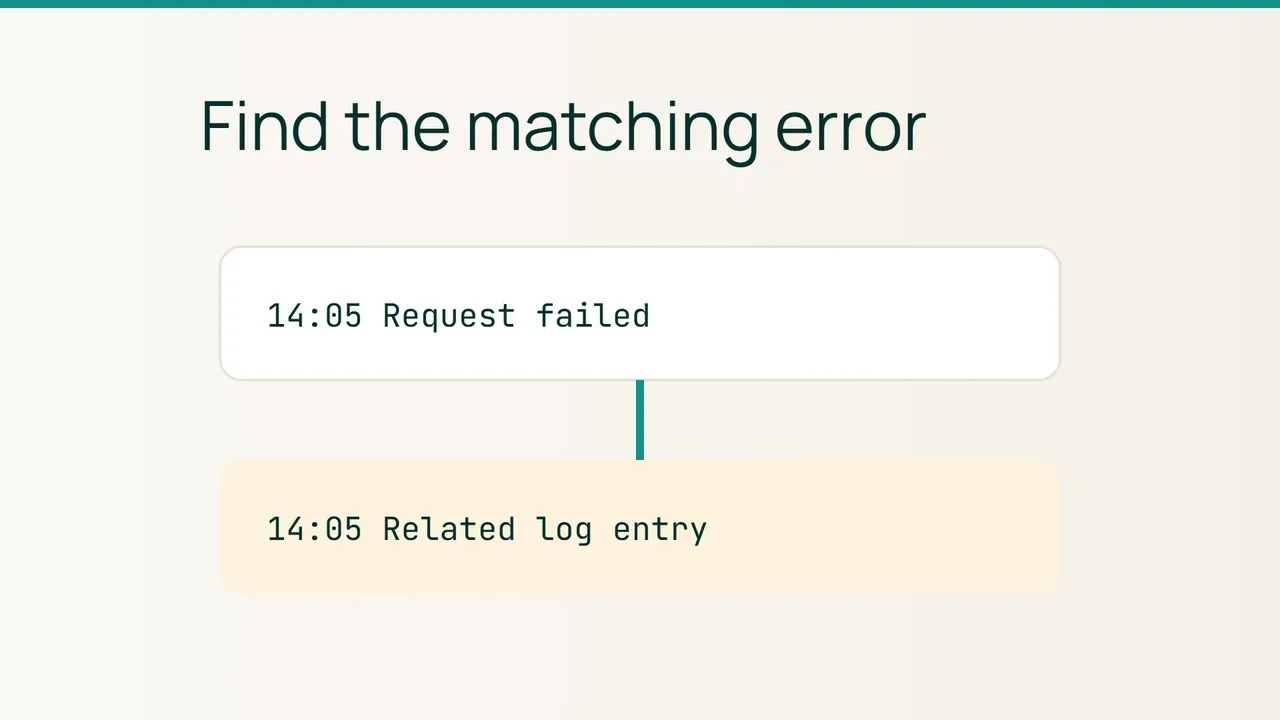
AWS's CloudWatch Omni announcement emphasises preserving context during an investigation. On cPanel hosting, you can make a website error report more useful by matching one browser action to relevant recent entries in the Errors interface.
1. Describe a request someone can reproduce
Choose a failing page or action that will not repeat an order, payment or message delivery. Record the domain, requested path, observation time and timezone. Include whether you were signed in and what you expected to happen.
Replace a broad statement such as “the website is broken” with a testable observation. For example, submitting the search form produces an error page while the home page still loads. Use fictional search input rather than customer information when reproducing the behaviour.
If a change preceded the failure, record its time and nature without declaring it the cause. A recent deployment is a useful clue, but another component could be responsible. Keeping observation separate from explanation makes the eventual support exchange more productive.
2. Match the observation in Errors
Open cPanel's Errors interface soon after reproducing the problem. It shows up to 300 recent web-server error entries, newest first. Look near the recorded time for messages associated with the relevant hostname or path.
Capture the useful excerpt and a little surrounding context when needed. A message from the same second is not automatically connected to your request. Compare the path and component, and consider whether the same symptom and message recur together.
An empty list is not an application health check. Some processing has separate logs, while older entries may no longer appear in this view. Ask support which log covers the operation if you cannot find a match, rather than repeatedly triggering the failure without a clear purpose.
3. Send evidence and repeat the same test
Prepare a concise report with the action, expected result, observed result, timestamp with timezone and relevant excerpt. Remove passwords, tokens and personal information while preserving the technical structure needed to understand the message.
Ask support to confirm the correlation and identify the next check. Avoid changing several PHP settings or file permissions just because a familiar word appears in the error. A controlled investigation should leave a clear connection between a proposed fix and its result.
After the agreed correction, repeat the original browser action and record what happens. Check for a corresponding new error. Close the report when the user journey works and any remaining messages have been explained, rather than assuming a quieter log display proves the website has recovered.