

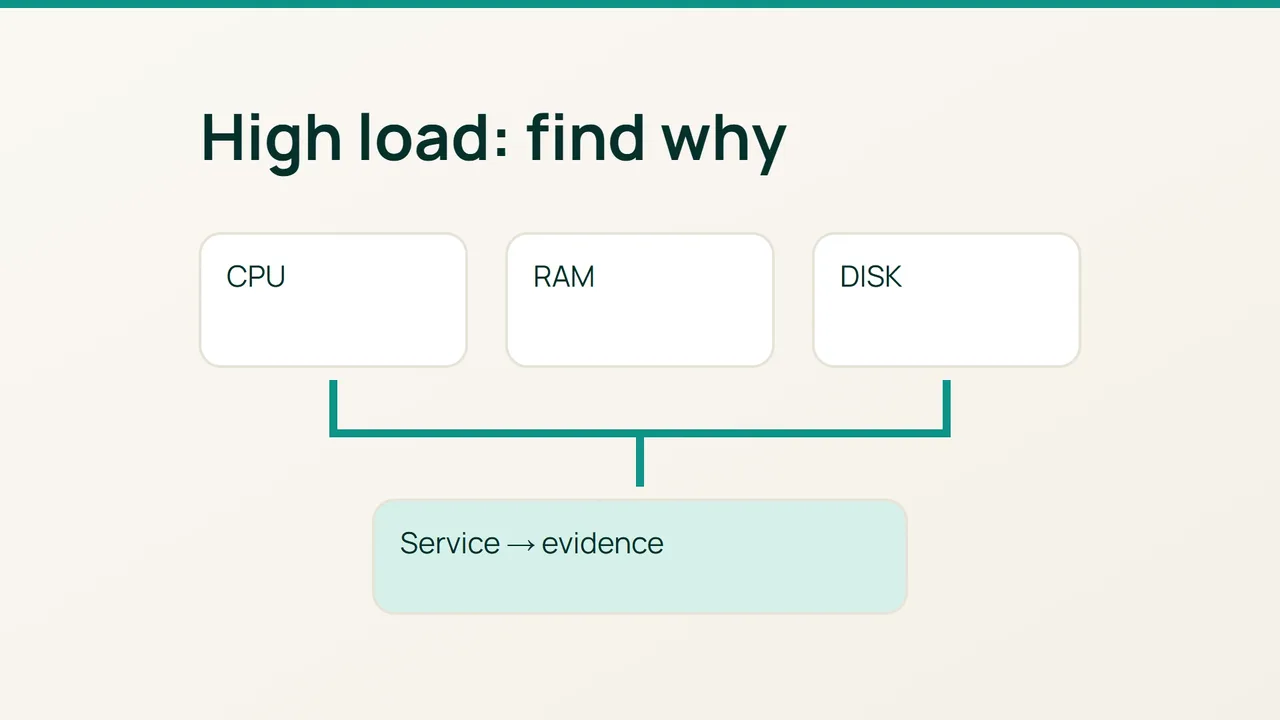
cPanel’s troubleshooting guidance starts by identifying which resource is under pressure. Use that approach to build an incident record while the slowdown is happening, with WHM administration and root SSH access available.
1. Establish what changed
Write down the incident time, affected domains and any backup or import running nearby. A quiet server after a restart cannot explain the original event, so take a few observations before changing anything.
date -Isuptimenprocfree -mtopLoad Average is not CPU utilization. Interpret its trend alongside the available processors and current process states. In top, check CPU activity, memory pressure and disk waiting together. Used swap alone is insufficient evidence that the machine is currently short of memory.
If available, htop makes it easier to follow related workers. Do not interrupt useful observation just to install a preferred interface: the built-in process listing can provide the first evidence.
2. Choose a service investigation
Collect a process ranking and a short disk sample using the tools already installed:
ps -eo user,pid,ppid,pcpu,pmem,comm \ --sort=-pcpu | head -20iostat -xz 1 5iotop -oFor busy PHP workers, record the operating-system user and pool, then investigate the requests reaching that application. If Apache dominates, inspect its status in WHM and compare occupied workers with access logs. For LiteSpeed, use its own runtime statistics and logs instead of assuming Apache’s process behavior applies.
When MySQL or MariaDB is busy, inspect active database work and waits through WHM. A disk-heavy backup is a different incident: correlate the process activity in iotop with the device measurements in iostat. If incidents recur at a fixed time, compare that timeline with cron and backup schedules.
Do not identify the largest visible process as the cause solely because it is large. A worker may be waiting for a downstream service, and a shared daemon may serve several accounts.
3. Prove the proposed correction
Turn the evidence into a testable statement, such as “this account’s export overlaps every slowdown.” Move that job for one controlled trial and compare equivalent traffic periods. Investigate expensive application paths or database work when those are the supported leads.
Avoid blanket process termination or raising every concurrency limit. Both can hide the original cause; extra concurrency can amplify the bottleneck. Keep a before-and-after record containing request volume, response time, the affected resource and the intervention. Recovery means the website works under comparable demand, with the identified pressure removed.
Sources: cPanel — high server loads, cPanel — disk I/O.